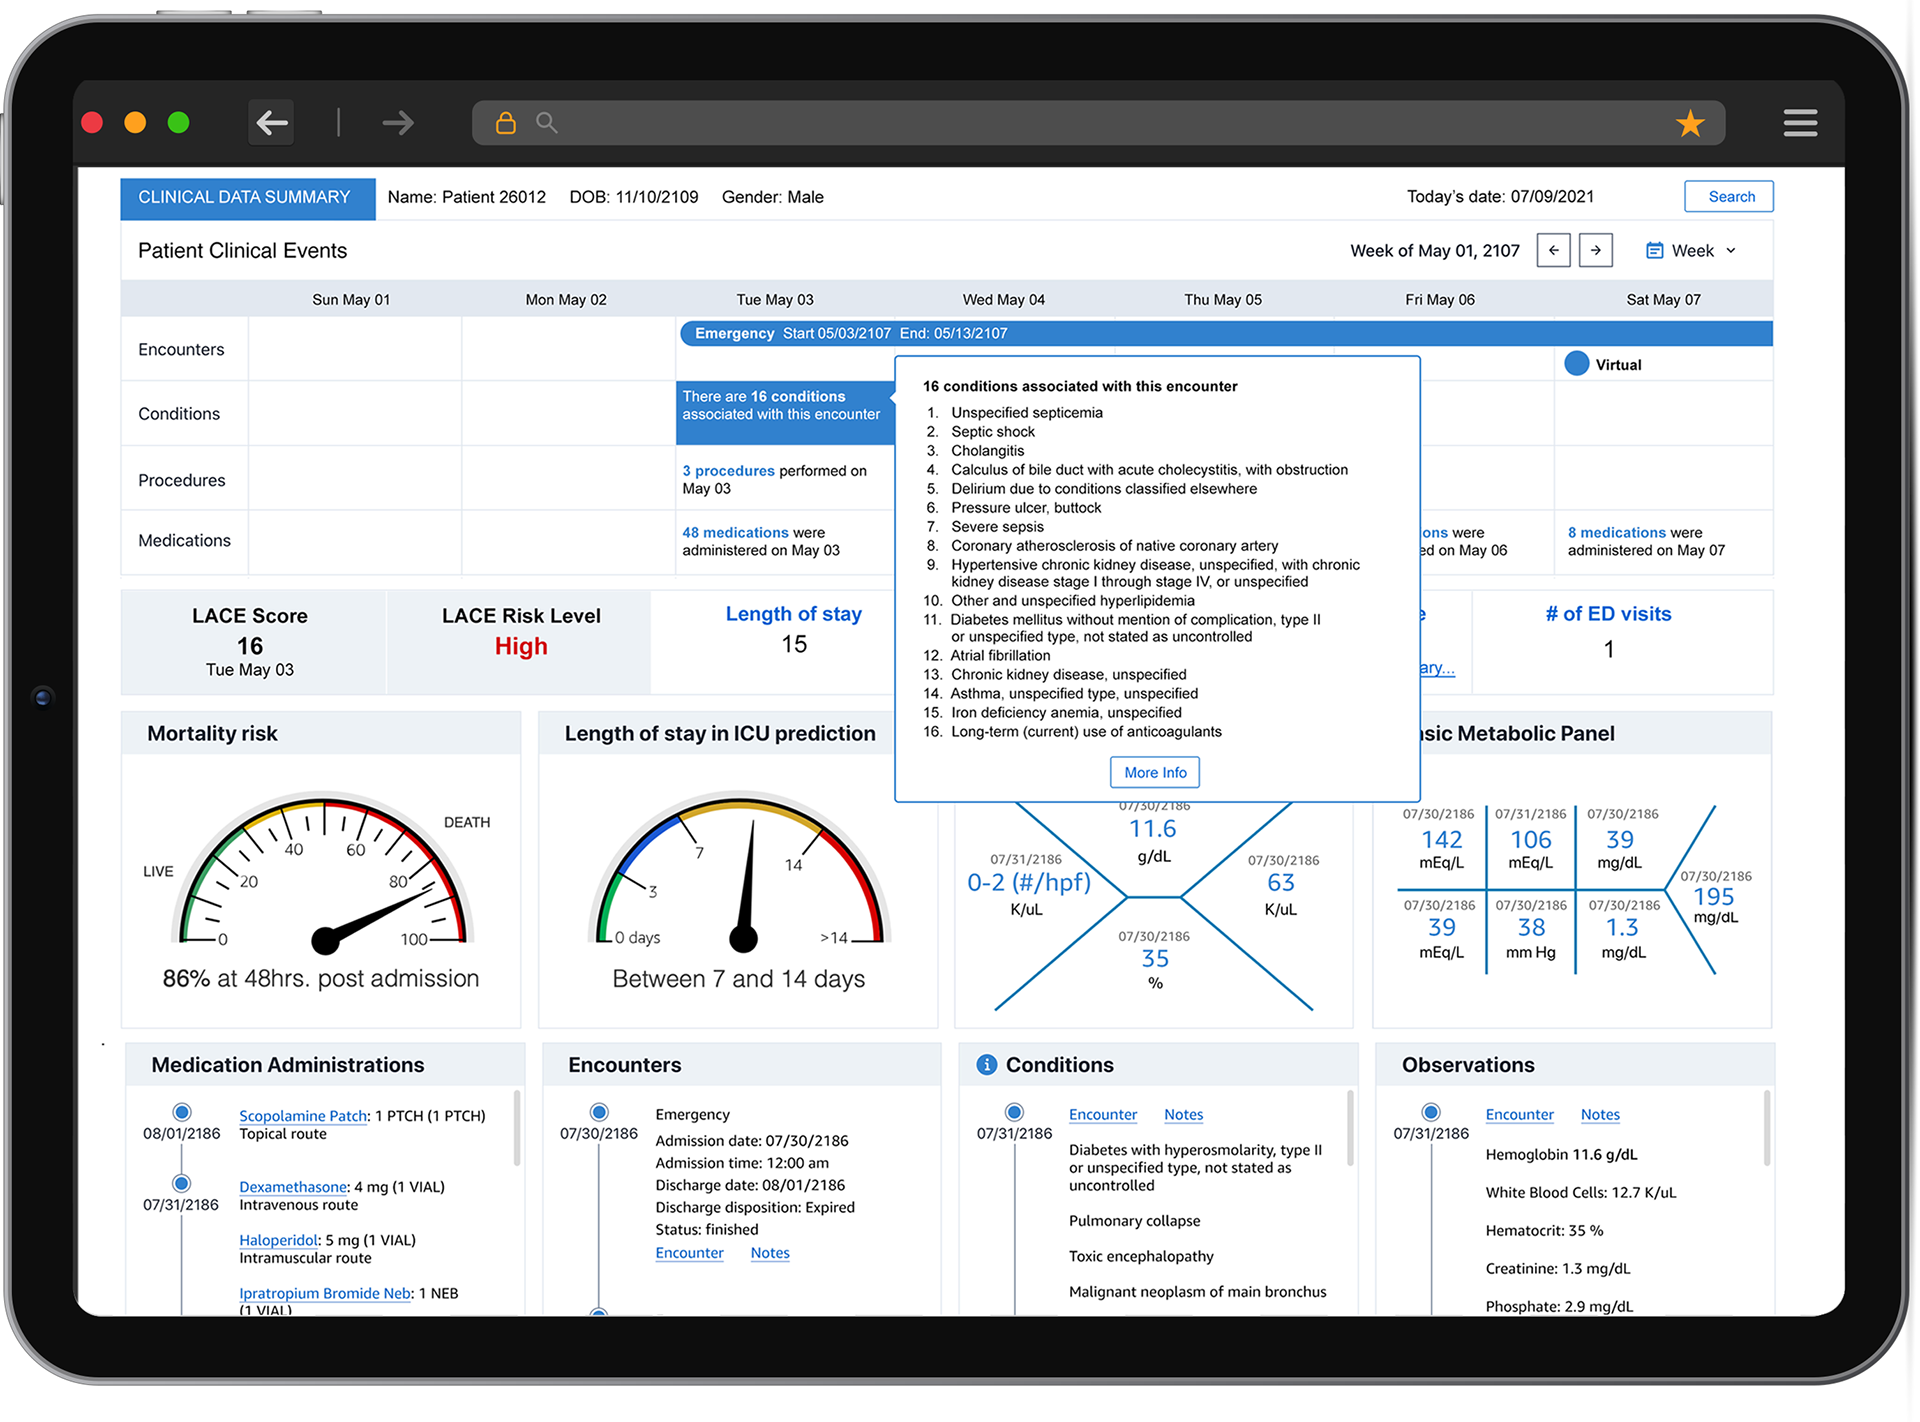
Final HDI dashboard interface showing AI-assisted patient timeline, encounter history, and lab trends
Background
Health Data Insights (HDI) is an AI-powered solution designed to help medical professionals explore longitudinal patient records, extract insights from unstructured clinical data, and reduce cognitive load when reviewing Electronic Health Records (EHR). Built on Amazon HealthLake and AWS machine learning services, HDI supports advanced data visualization, natural language processing (NLP), and ontology mapping (e.g., ICD-10, RxNorm).
This tool was developed in collaboration with the Amazon HealthLake team and launched during AWS re:Invent 2021. as part of the Amazon HealthLake announcement.
The Problem
Healthcare professionals face growing complexity in navigating siloed, unstructured EHR data, which slows decision-making and adds administrative burden. Existing tools fail to offer an integrated, intelligent, and visual way to explore a patient's full clinical history. The challenge: Design a reference application that demonstrates how Amazon HealthLake and ML services could extract, organize, and surface meaningful health insights in a secure, scalable, and intuitive way.
My Contribution
As the sole UX designer on this project, I led the full design process—from user research and concept testing to prototyping and final delivery. I collaborated closely with engineering, science, and product teams across Amazon HealthLake to align on technical feasibility and service capabilities. In parallel, I worked with my own cross-functional team—including ML engineers, data scientists, deep learning experts, and front-end developers—to translate user needs into a functional, scalable demo tool. This dual-track collaboration ensured that the design not only addressed real healthcare pain points but also remained achievable within the tight timeline for the AWS re:Invent 2021 launch.
Design Process
Phase 1: Concept Exploration & Evaluative Research
We developed five technically feasible concepts aligned with business and customer goals. These were tested with 10 participants, including physicians and healthcare admins, through remote 60-minute moderated interviews.
Concepts presented included:
•Longitudinal timeline view of patient clinical data
•Benchmark comparison with patient cohorts
•Automatic clinical encounter generation from unstructured inputs (e.g., audio)
•Knowledge graph interface for navigating clinical notes
•Hospital admin dashboards (telehealth vs. hospital)
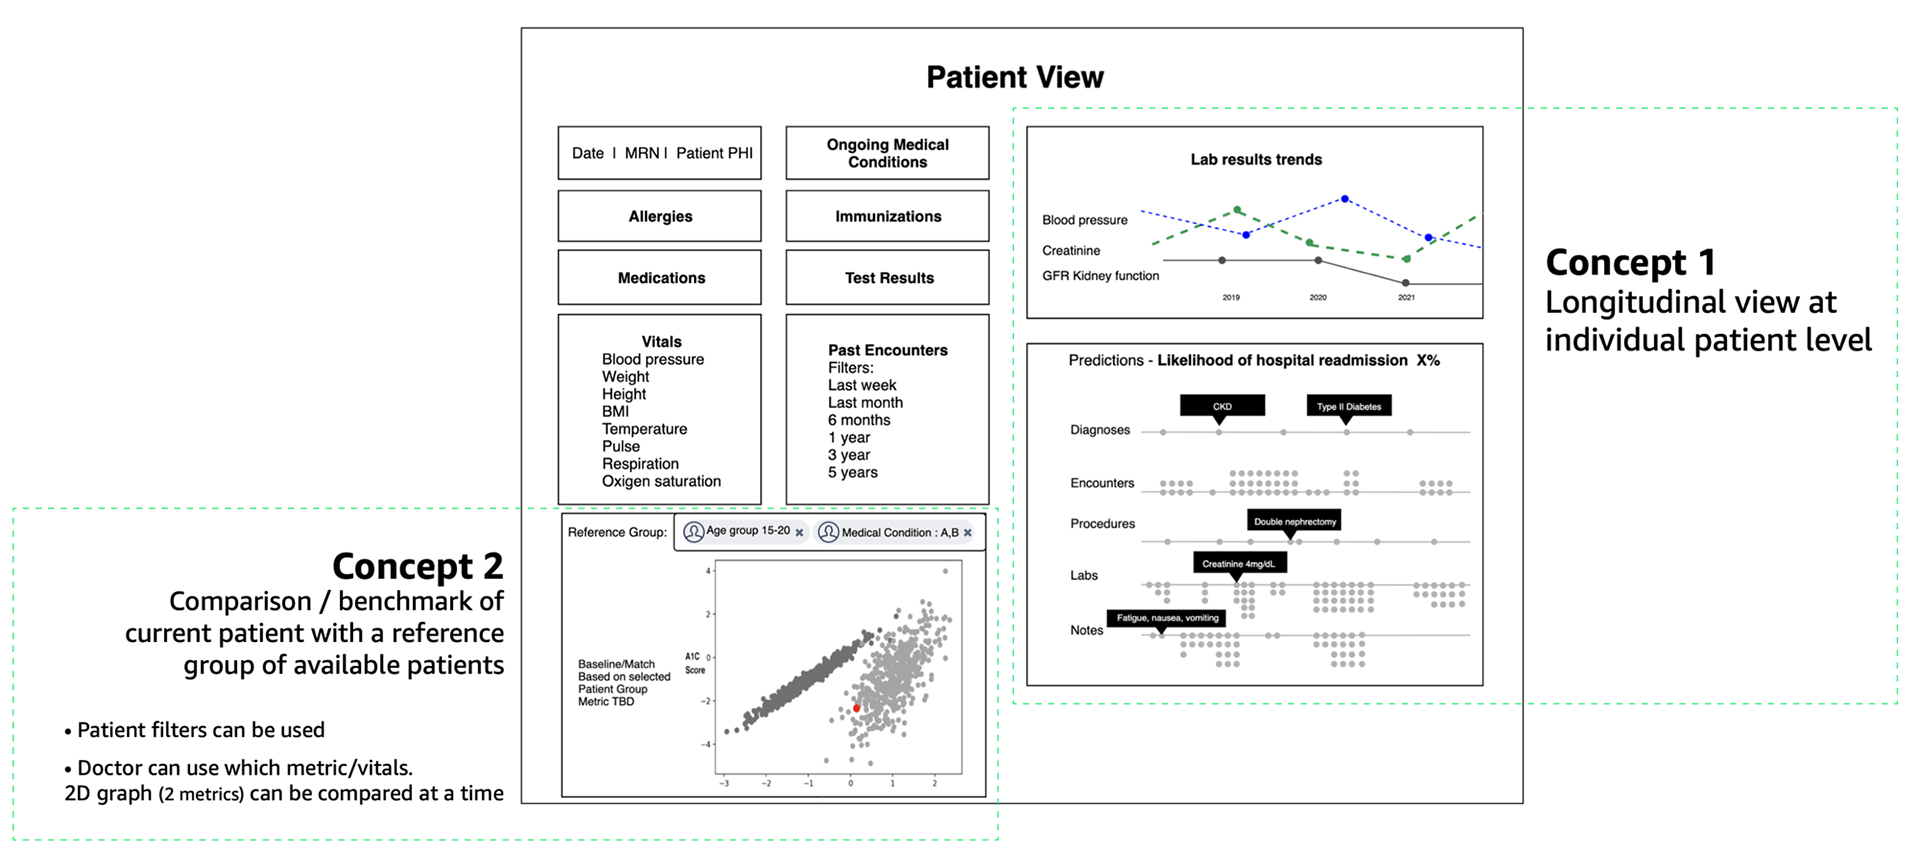
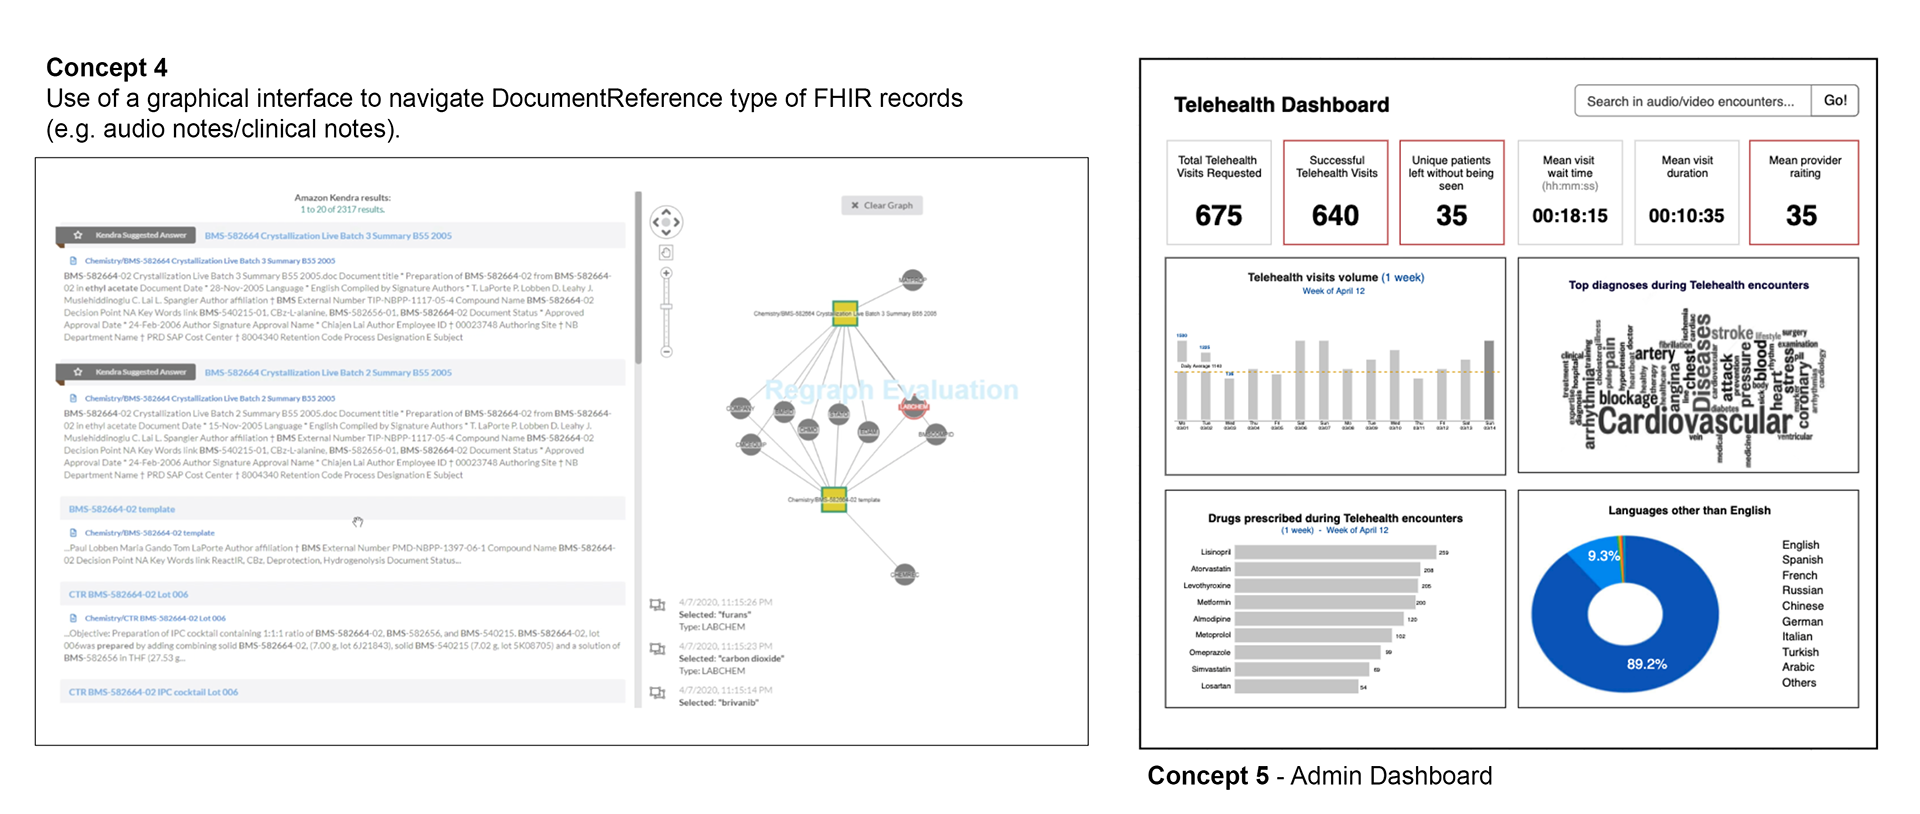
Early design concepts tested with healthcare professionals to assess value, usability, and feasibility.
Key insights and recommendations:
Top findings from research included:
1. Timeline View = Highest Value
Visualizing a patient’s clinical history chronologically was the most impactful and understandable to clinicians.
Visualizing a patient’s clinical history chronologically was the most impactful and understandable to clinicians.
2. Emphasize ML Over EHR
Participants wanted the experience to clearly highlight how Amazon HealthLake’s machine learning capabilities go beyond traditional EHR systems. They emphasized the value of predictive features—such as disease progression, hospital readmission risk, and mortality risk—as key differentiators that should be more prominently showcased.
Participants wanted the experience to clearly highlight how Amazon HealthLake’s machine learning capabilities go beyond traditional EHR systems. They emphasized the value of predictive features—such as disease progression, hospital readmission risk, and mortality risk—as key differentiators that should be more prominently showcased.
3. Ease of Integration & Explainability
Users highlighted the need for explainable results and easy EHR integration. Trust and speed were key decision factors.
Users highlighted the need for explainable results and easy EHR integration. Trust and speed were key decision factors.
4. Cohort Comparison Not Feasible
Although compelling, we lacked sufficient clean benchmark data for this concept at launch.
Although compelling, we lacked sufficient clean benchmark data for this concept at launch.
Design Iteration Highlights
Several rounds of research and design iterations were performed to evolve and refine the concepts. A few highlights are described below.
First iteration: Tabbed Layout
Issues:
•Tab switching made it hard to view all relevant info
•Users disliked needing multiple clicks to access deep info
•Requested better visibility into care team and ongoing conditions
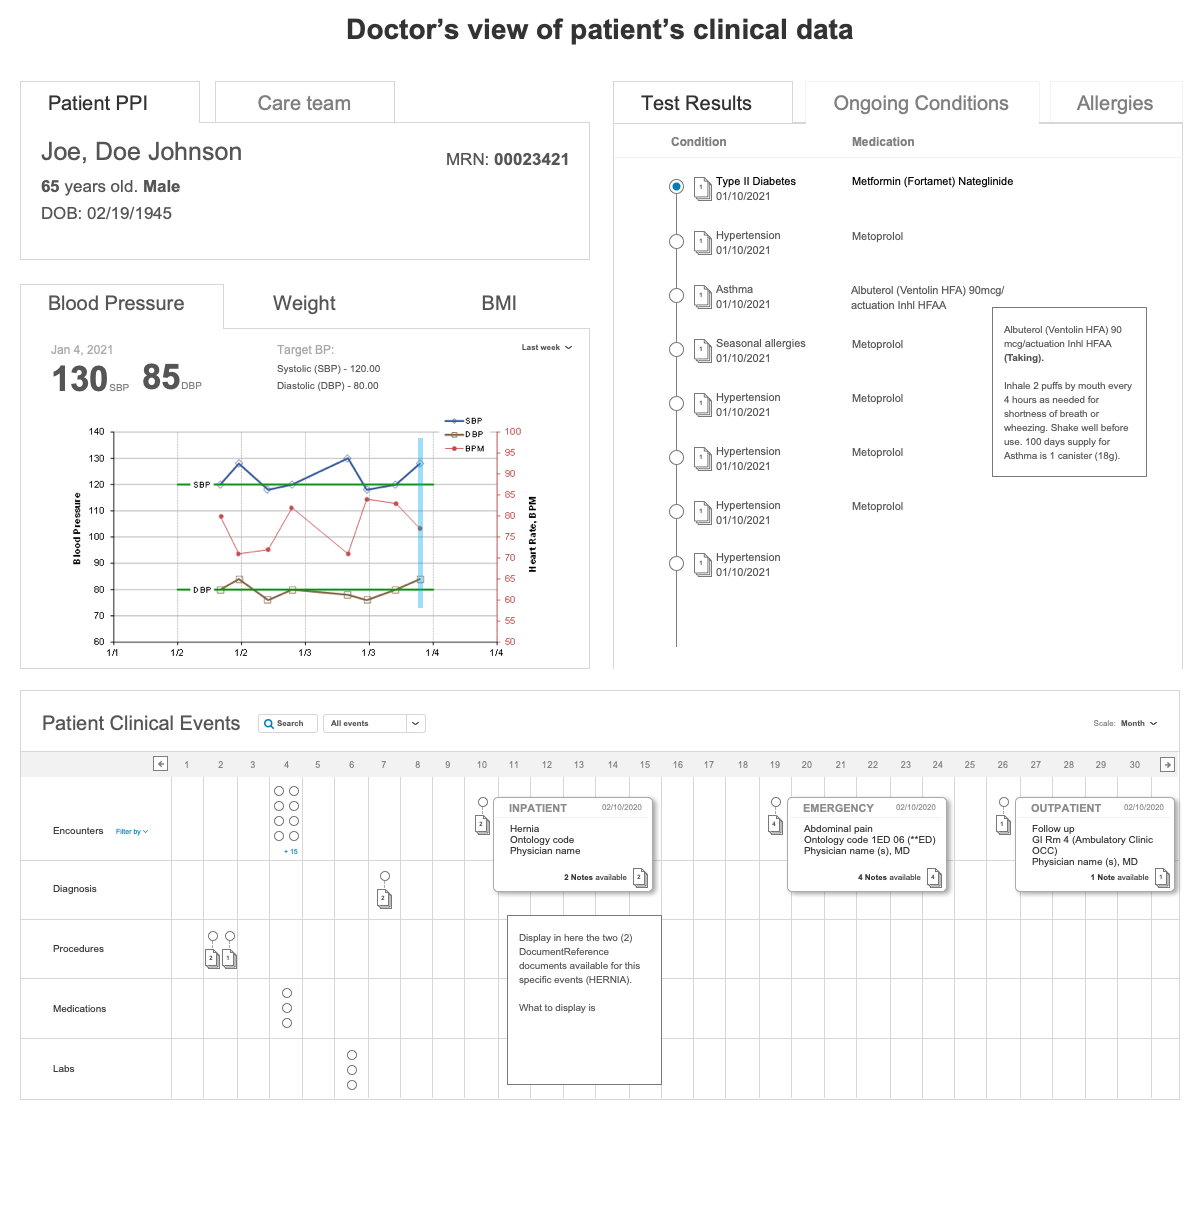
Second Iteration: Modular Layout
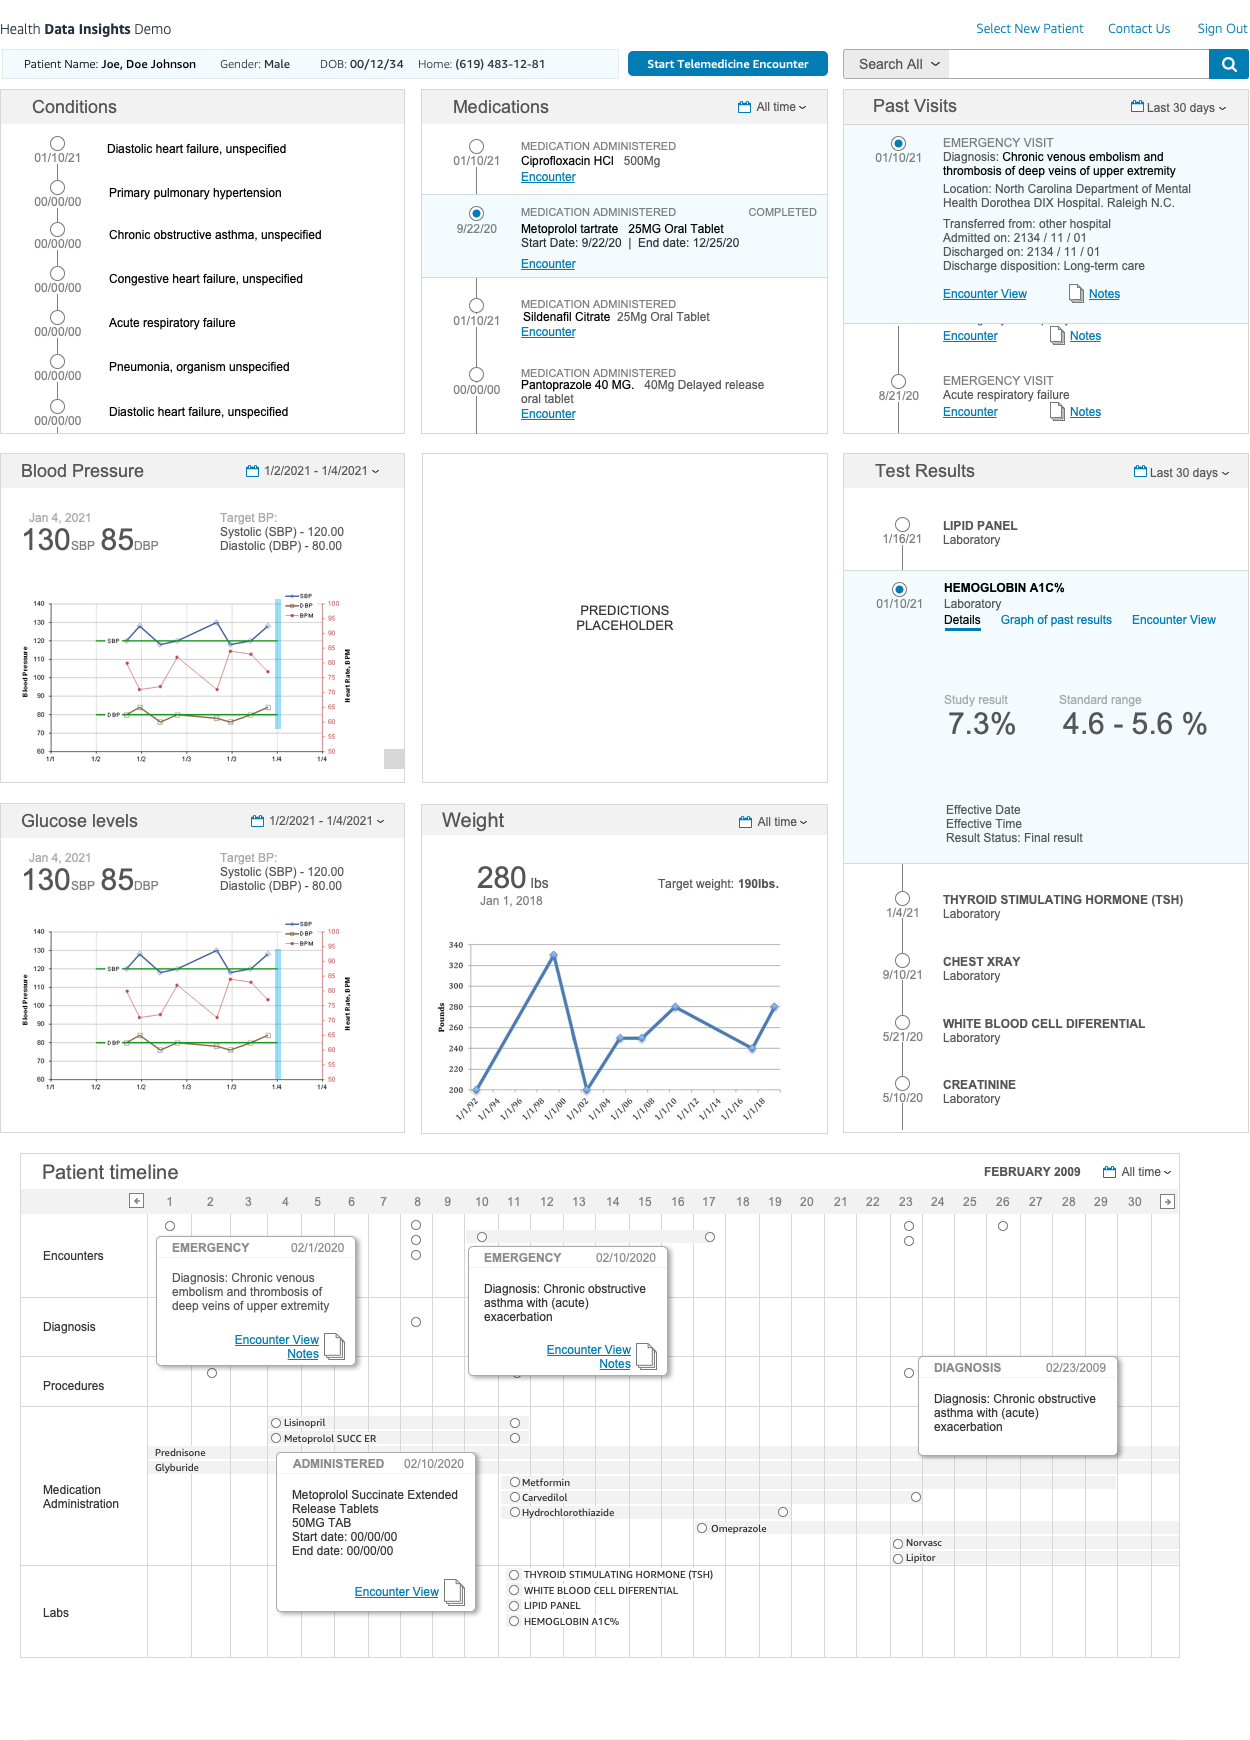
Improvements:
•Replaced tabs with stacked modules
•Chronological display of test results, allergies, and conditions
•Introduced visualizations (e.g., trends in vitals, blood pressure)
•Search by date/time added for timeline filtering
Final Iteration: Timeline & Lab Trends
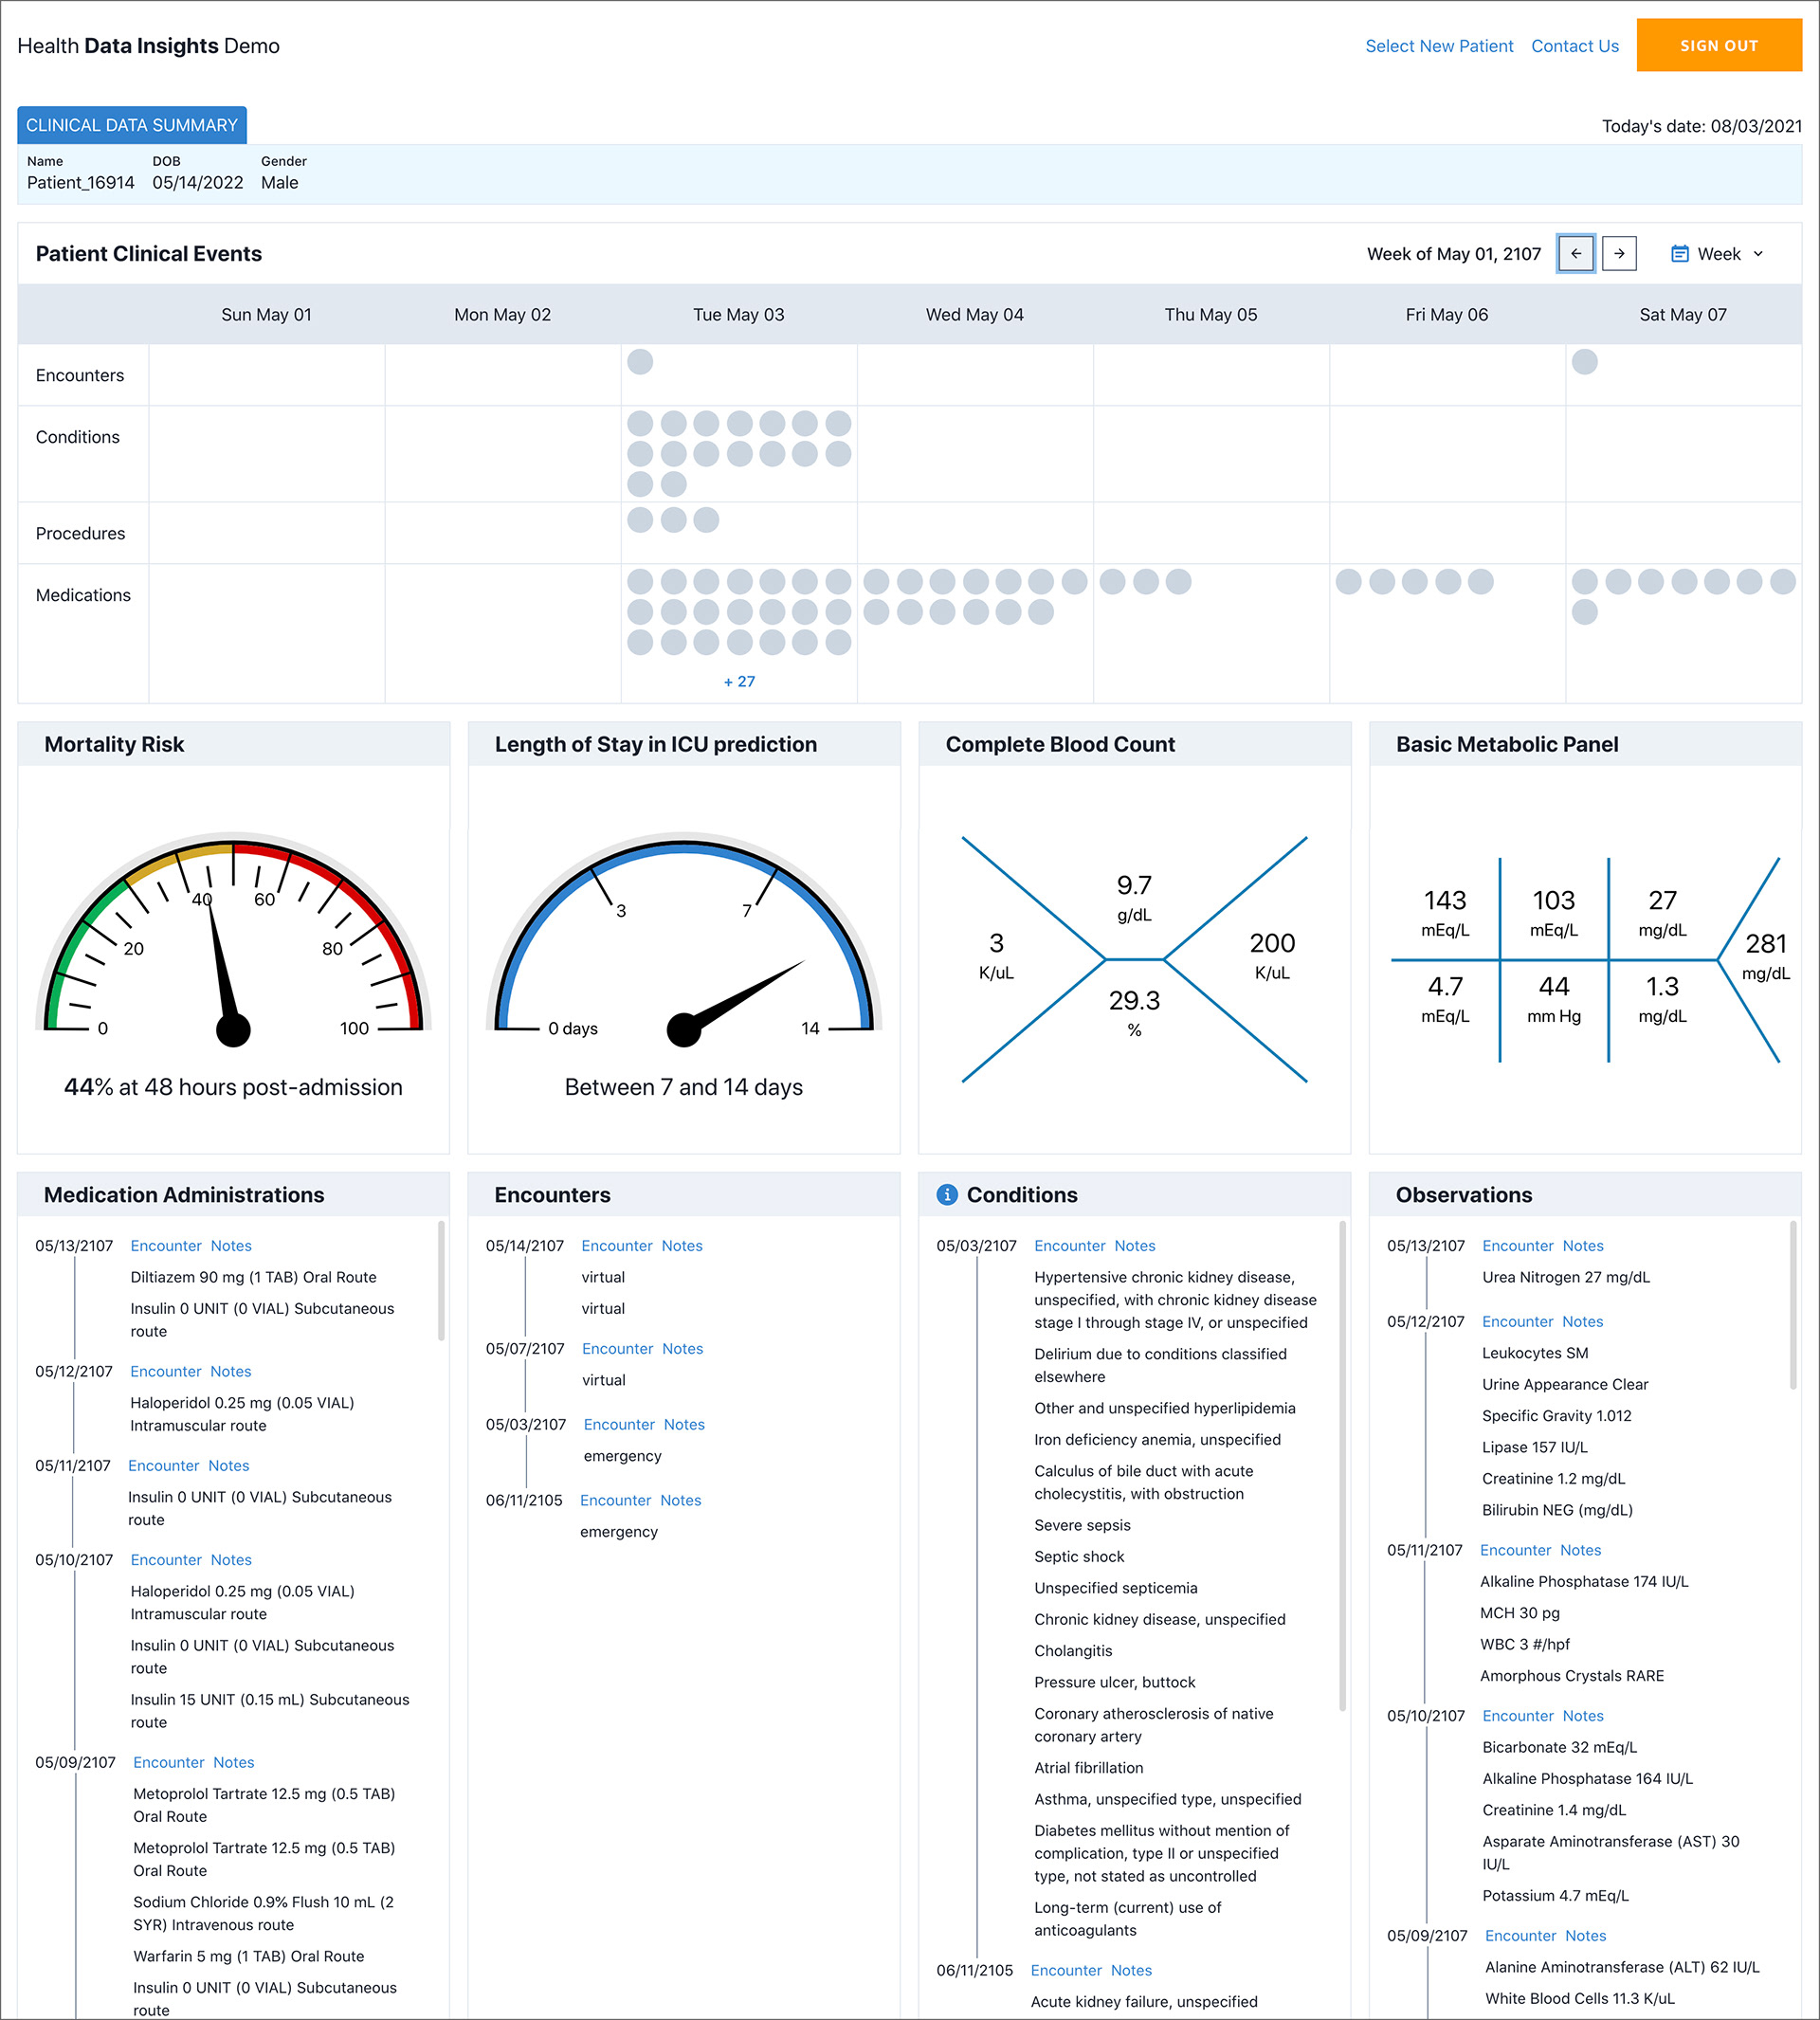
Key Updates:
•Timeline moved to the top of the screen
•Hover and drawer UI for exploring encounters
•Fishbone diagram for Complete Blood Count (CBC) and Metabolic Panel labs
•Highlighted most recent labs with tooltips and normal ranges
Final Design Features:
Patient Timeline & Encounter Details
The final interface centered around a dynamic patient timeline designed to surface key clinical events at a glance—optimized for speed and clarity in critical decision-making.
The final interface centered around a dynamic patient timeline designed to surface key clinical events at a glance—optimized for speed and clarity in critical decision-making.
Timeline Overview
All recent encounters, diagnoses, procedures, and administered medications are visualized chronologically. Hovering over a timeline cell reveals a high-level summary of that clinical event, helping providers quickly assess patient status.
All recent encounters, diagnoses, procedures, and administered medications are visualized chronologically. Hovering over a timeline cell reveals a high-level summary of that clinical event, helping providers quickly assess patient status.
Interactive timeline showing recent clinical events, with tooltips for at-a-glance summaries.
Expanded Encounter Information
For more detail, users can click the More Info button within a tooltip to open a side drawer. This drawer surfaces all structured data and relevant documentation for that encounter, including raw clinician notes.
Expanded encounter drawer showing detailed structured data and clinical notes.
This dual-level interaction design—summary on hover, depth on demand—helps reduce click burden while ensuring access to all relevant patient context when needed.
Lab Notations
The dashboard highlights critical lab results—including Complete Blood Count (CBC) and Basic Metabolic Panel (BMP)—in a quick-scan visual format. Each value is displayed with color-coded indicators for abnormal results.
Hovering over a lab value reveals a tooltip with its standard reference range, helping clinicians interpret deviations without needing to cross-reference external sources.
Lab results section with tooltips showing reference ranges for CBC and BMP observations.
This design supports fast, informed interpretation of complex lab data while minimizing cognitive load.
Predictive Models
HDI integrates ML-powered predictions to provide clinical foresight that traditional EHRs lack.
Length of Stay Prediction
Based on admission data, the model forecasts an estimated ICU stay range—helping clinicians anticipate resource needs and set patient expectations.
Based on admission data, the model forecasts an estimated ICU stay range—helping clinicians anticipate resource needs and set patient expectations.
Mortality Risk
Using clinical data available within the first 48 hours of ICU admission, the system calculates the patient’s risk of mortality, enabling earlier, more proactive interventions.
Using clinical data available within the first 48 hours of ICU admission, the system calculates the patient’s risk of mortality, enabling earlier, more proactive interventions.
ML-powered predictions, including ICU length of stay and mortality risk,
visualized directly on the patient dashboard using early clinical data.
visualized directly on the patient dashboard using early clinical data.
Impact
Health Data Insights (HDI) launched alongside Amazon HealthLake at AWS re:Invent 2021 as a reference application that demonstrated the real-world potential of machine learning in clinical settings. Designed to help surface insights from complex EHR data, HDI showed how AWS health services could support physicians with predictive models, structured visualization, and intuitive workflows.
Today, HDI is part of the ready-to-deploy healthcare solutions available to AWS customers in the Healthcare & Life Sciences (HCLS) vertical. Hospitals and clinics around the world use it as a customizable starting point to integrate AI-powered insights directly into their clinical systems—without having to build from scratch. The application has helped accelerate AI adoption in healthcare by reducing integration overhead and providing a clear example of how machine learning can improve clinical decision-making, reduce manual burden, and enhance patient care.
Closing Thoughts
Designing for healthcare means balancing complexity, sensitivity, and clarity. Through Health Data Insights, I helped translate powerful ML capabilities into a usable, intuitive experience for medical professionals—empowering them to uncover critical patient insights without needing to decode raw data.
By collaborating closely across science, engineering, and product teams, we created a solution that not only launched successfully, but continues to support hospitals and clinics globally as part of AWS’s healthcare offerings.
This project reinforced how human-centered design can make cutting-edge AI truly accessible—and impactful—where it matters most.